libxlsxwriter
chart_data_labels.c
<< chart_data_tools.c chart_fonts.c >>

A demo of an various Excel chart data label features that are available via a libxlsxwriter chart, including custom data labels.

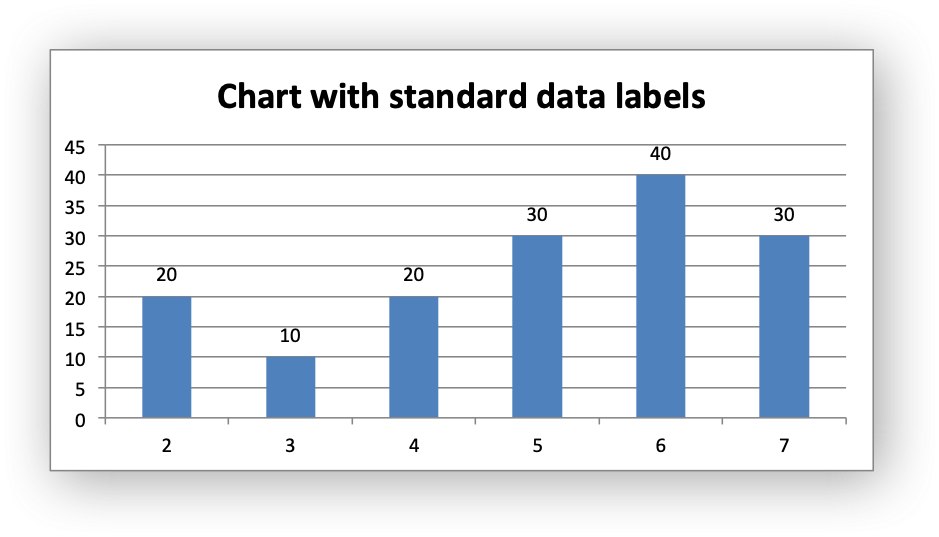
Chart 1: chart with standard data labels.

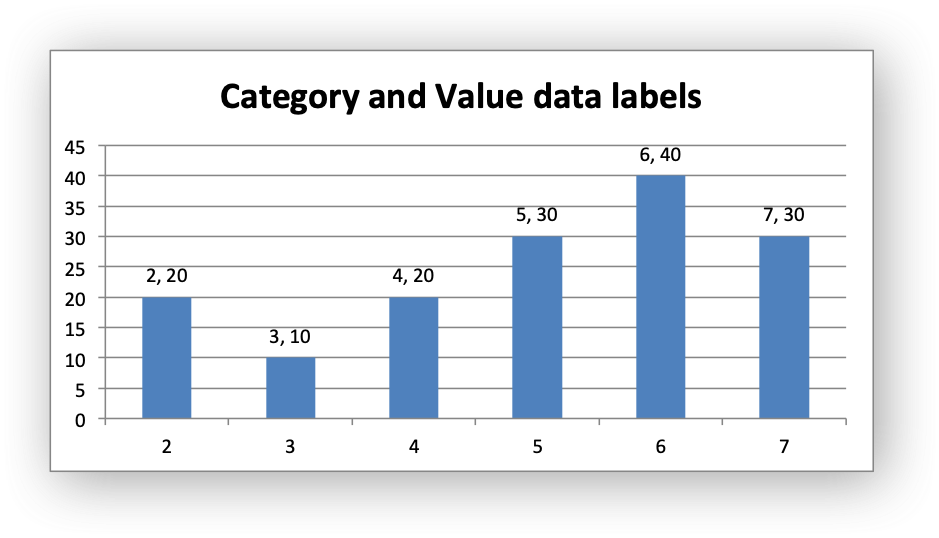
Chart 2: chart with Category and Value data labels.

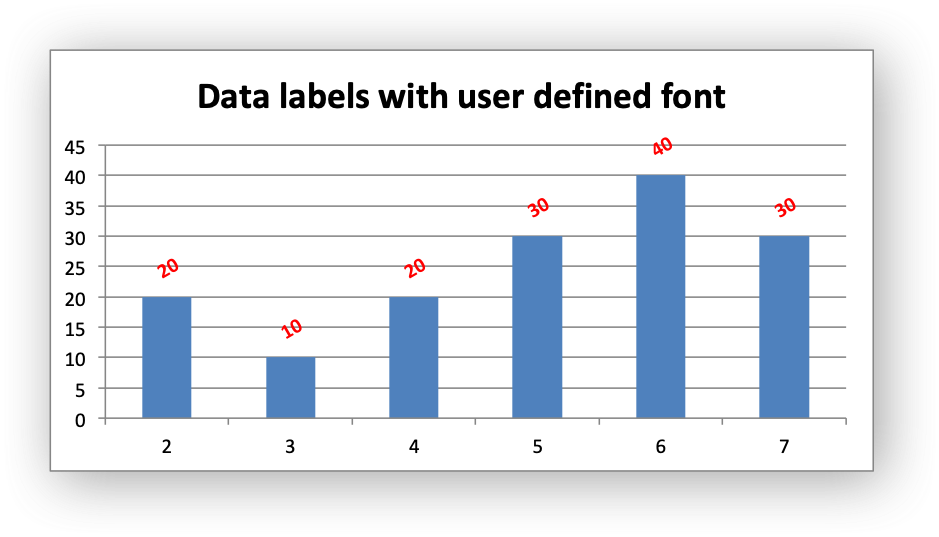
Chart 3: chart with data labels with a user defined font.

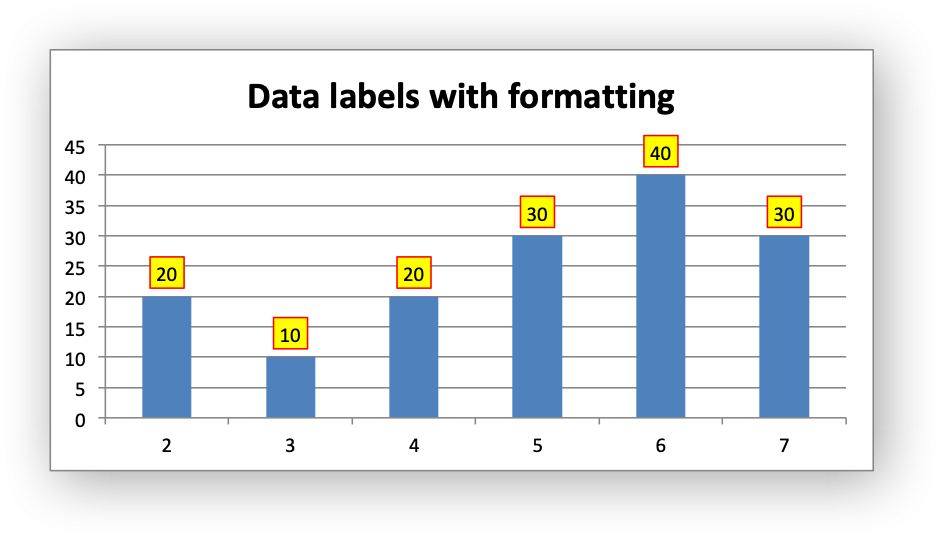
Chart 4: chart with data labels and formatting.

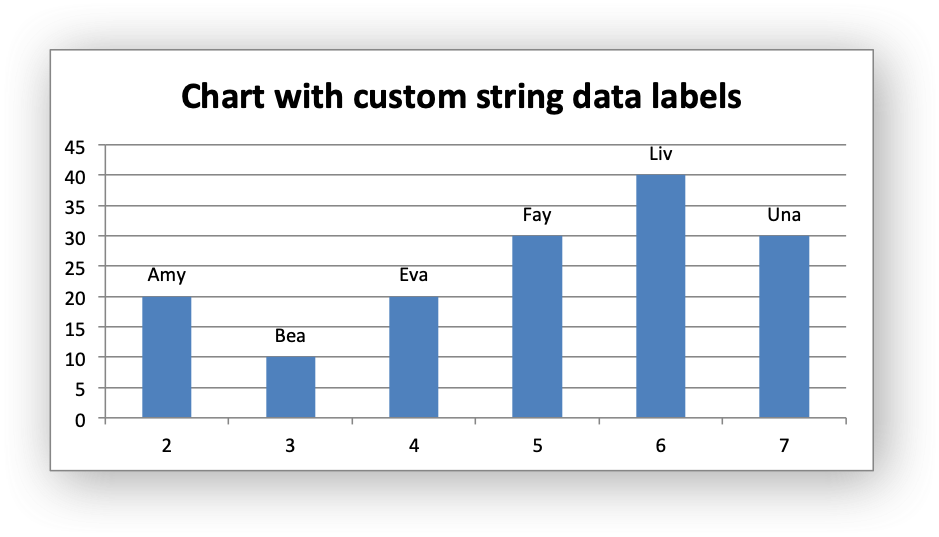
Chart 5: chart with custom string data labels.

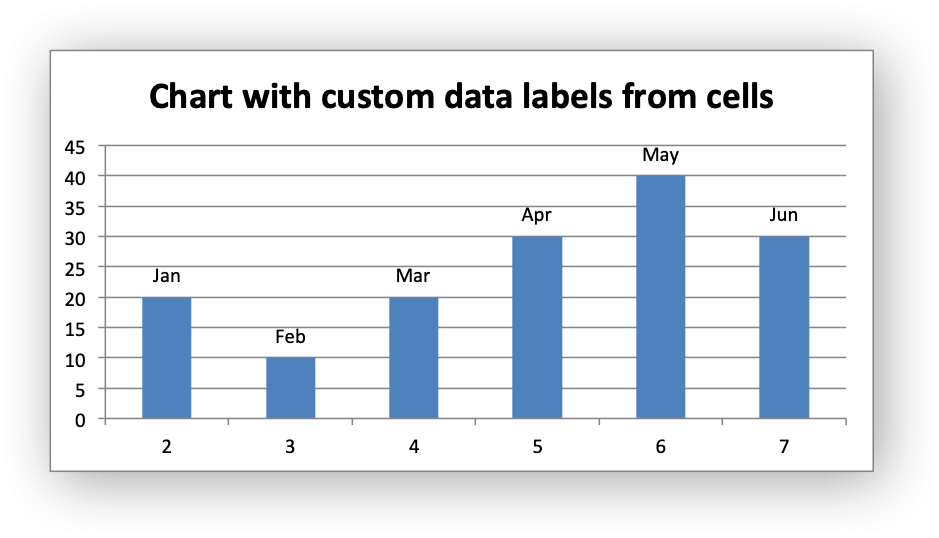
Chart 6: chart with custom data labels referenced from worksheet cells.

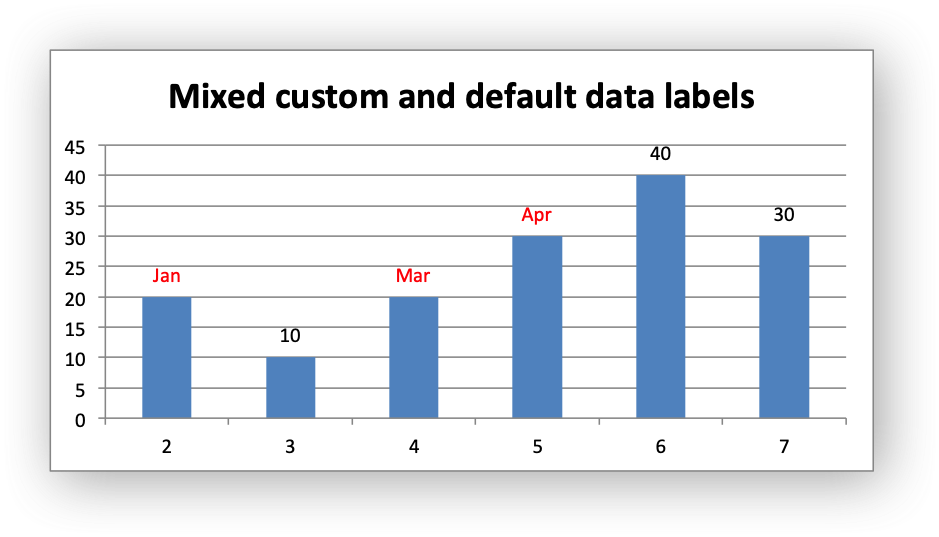
Chart 7: chart with a mix of custom and default labels. The items initialized with '{0}' and items without a custom label (points 5 and 6 which come after NULL) will get the default value. We also set a font for the custom items as an extra example.

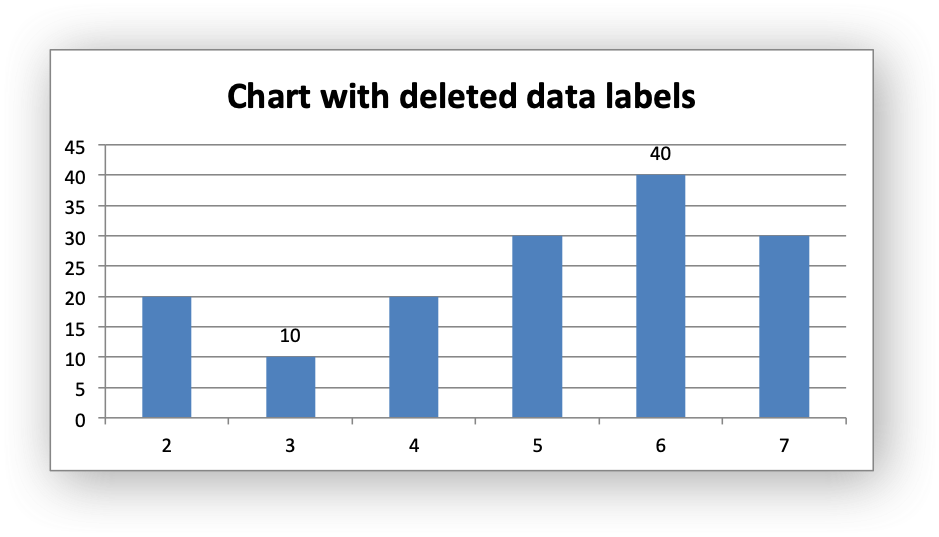
Chart 8: chart with some deleted custom labels and defaults.

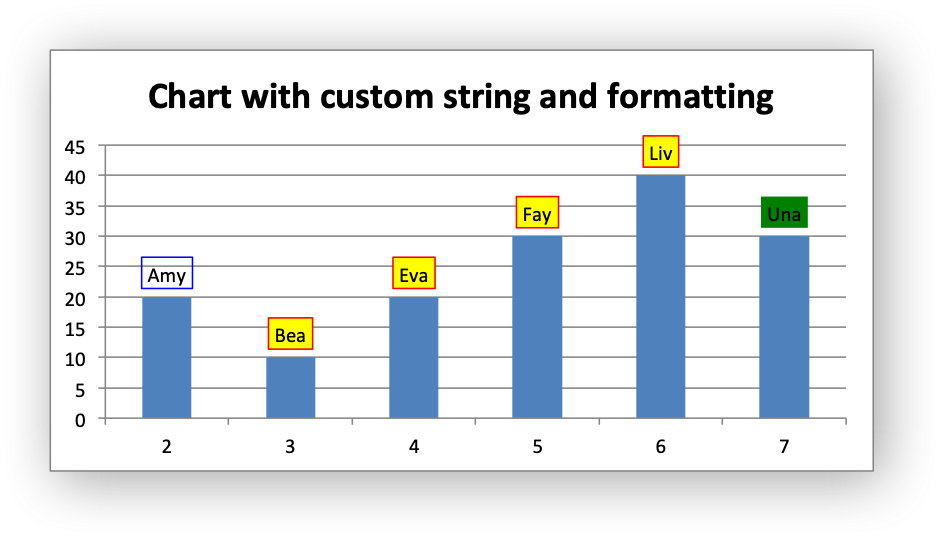
Chart 9: chart with custom string data labels and formatting.

/*
* A demo of an various Excel chart data label features that are available via
* a libxlsxwriter chart.
*
* Copyright 2014-2021, John McNamara, jmcnamara@cpan.org
*
*/
#include "xlsxwriter.h"
/*
* Create a worksheet with examples charts.
*/
int main() {
lxw_workbook *workbook = workbook_new("chart_data_labels.xlsx");
lxw_worksheet *worksheet = workbook_add_worksheet(workbook, NULL);
/* Add a bold format to use to highlight the header cells. */
lxw_format *bold = workbook_add_format(workbook);
/* Some chart positioning options. */
lxw_chart_options options = {.x_offset = 25, .y_offset = 10};
/* Write some data for the chart. */
worksheet_write_string(worksheet, 0, 0, "Number", bold);
worksheet_write_number(worksheet, 1, 0, 2, NULL);
worksheet_write_number(worksheet, 2, 0, 3, NULL);
worksheet_write_number(worksheet, 3, 0, 4, NULL);
worksheet_write_number(worksheet, 4, 0, 5, NULL);
worksheet_write_number(worksheet, 5, 0, 6, NULL);
worksheet_write_number(worksheet, 6, 0, 7, NULL);
worksheet_write_string(worksheet, 0, 1, "Data", bold);
worksheet_write_number(worksheet, 1, 1, 20, NULL);
worksheet_write_number(worksheet, 2, 1, 10, NULL);
worksheet_write_number(worksheet, 3, 1, 20, NULL);
worksheet_write_number(worksheet, 4, 1, 30, NULL);
worksheet_write_number(worksheet, 5, 1, 40, NULL);
worksheet_write_number(worksheet, 6, 1, 30, NULL);
worksheet_write_string(worksheet, 0, 2, "Text", bold);
worksheet_write_string(worksheet, 1, 2, "Jan", NULL);
worksheet_write_string(worksheet, 2, 2, "Feb", NULL);
worksheet_write_string(worksheet, 3, 2, "Mar", NULL);
worksheet_write_string(worksheet, 4, 2, "Apr", NULL);
worksheet_write_string(worksheet, 5, 2, "May", NULL);
worksheet_write_string(worksheet, 6, 2, "Jun", NULL);
/*
* Chart 1. Example with standard data labels.
*/
/* Add a chart title. */
chart_title_set_name(chart, "Chart with standard data labels");
/* Add a data series to the chart. */
lxw_chart_series *series = chart_add_series(chart, "=Sheet1!$A$2:$A$7",
"=Sheet1!$B$2:$B$7");
/* Add the series data labels. */
/* Turn off the legend. */
/* Insert the chart into the worksheet. */
worksheet_insert_chart_opt(worksheet, CELL("D2"), chart, &options);
/*
* Chart 2. Example with value and category data labels.
*/
/* Add a chart title. */
chart_title_set_name(chart, "Category and Value data labels");
/* Add a data series to the chart. */
series = chart_add_series(chart, "=Sheet1!$A$2:$A$7",
"=Sheet1!$B$2:$B$7");
/* Add the series data labels. */
/* Turn on Value and Category labels. */
/* Turn off the legend. */
/* Insert the chart into the worksheet. */
worksheet_insert_chart_opt(worksheet, CELL("D18"), chart, &options);
/*
* Chart 3. Example with standard data labels with different font.
*/
/* Add a chart title. */
chart_title_set_name(chart, "Data labels with user defined font");
/* Add a data series to the chart. */
series = chart_add_series(chart, "=Sheet1!$A$2:$A$7",
"=Sheet1!$B$2:$B$7");
/* Add the series data labels. */
lxw_chart_font font1 = {.bold = LXW_TRUE, .color = LXW_COLOR_RED, .rotation = -30};
/* Turn off the legend. */
/* Insert the chart into the worksheet. */
worksheet_insert_chart_opt(worksheet, CELL("D34"), chart, &options);
/*
* Chart 4. Example with standard data labels and formatting.
*/
/* Add a chart title. */
chart_title_set_name(chart, "Data labels with formatting");
/* Add a data series to the chart. */
series = chart_add_series(chart, "=Sheet1!$A$2:$A$7",
"=Sheet1!$B$2:$B$7");
/* Add the series data labels. */
/* Set the border/line and fill for the data labels. */
/* Turn off the legend. */
/* Insert the chart into the worksheet. */
worksheet_insert_chart_opt(worksheet, CELL("D50"), chart, &options);
/*
* Chart 5.Example with custom string data labels.
*/
/* Add a chart title. */
chart_title_set_name(chart, "Chart with custom string data labels");
/* Add a data series to the chart. */
series = chart_add_series(chart, "=Sheet1!$A$2:$A$7",
"=Sheet1!$B$2:$B$7");
/* Add the series data labels. */
/* Create some custom labels. */
lxw_chart_data_label data_label5_1 = {.value = "Amy"};
lxw_chart_data_label data_label5_2 = {.value = "Bea"};
lxw_chart_data_label data_label5_3 = {.value = "Eva"};
lxw_chart_data_label data_label5_4 = {.value = "Fay"};
lxw_chart_data_label data_label5_5 = {.value = "Liv"};
lxw_chart_data_label data_label5_6 = {.value = "Una"};
/* Create an array of label pointers. NULL indicates the end of the array. */
lxw_chart_data_label *data_labels5[] = {
&data_label5_1,
&data_label5_2,
&data_label5_3,
&data_label5_4,
&data_label5_5,
&data_label5_6,
NULL
};
/* Set the custom labels. */
chart_series_set_labels_custom(series, data_labels5);
/* Turn off the legend. */
/* Insert the chart into the worksheet. */
worksheet_insert_chart_opt(worksheet, CELL("D66"), chart, &options);
/*
* Chart 6. Example with custom data labels from cells.
*/
/* Add a chart title. */
chart_title_set_name(chart, "Chart with custom data labels from cells");
/* Add a data series to the chart. */
series = chart_add_series(chart, "=Sheet1!$A$2:$A$7",
"=Sheet1!$B$2:$B$7");
/* Add the series data labels. */
/* Create some custom labels. */
lxw_chart_data_label data_label6_1 = {.value = "=Sheet1!$C$2"};
lxw_chart_data_label data_label6_2 = {.value = "=Sheet1!$C$3"};
lxw_chart_data_label data_label6_3 = {.value = "=Sheet1!$C$4"};
lxw_chart_data_label data_label6_4 = {.value = "=Sheet1!$C$5"};
lxw_chart_data_label data_label6_5 = {.value = "=Sheet1!$C$6"};
lxw_chart_data_label data_label6_6 = {.value = "=Sheet1!$C$7"};
/* Create an array of label pointers. NULL indicates the end of the array. */
lxw_chart_data_label *data_labels6[] = {
&data_label6_1,
&data_label6_2,
&data_label6_3,
&data_label6_4,
&data_label6_5,
&data_label6_6,
NULL
};
/* Set the custom labels. */
chart_series_set_labels_custom(series, data_labels6);
/* Turn off the legend. */
/* Insert the chart into the worksheet. */
worksheet_insert_chart_opt(worksheet, CELL("D82"), chart, &options);
/*
* Chart 7. Example with custom and default data labels.
*/
/* Add a chart title. */
chart_title_set_name(chart, "Mixed custom and default data labels");
/* Add a data series to the chart. */
series = chart_add_series(chart, "=Sheet1!$A$2:$A$7",
"=Sheet1!$B$2:$B$7");
/* Add the series data labels. */
/* Create some custom labels. */
/* The following is used to get a mix of default and custom labels. The
* items initialized with '{0}' and items without a custom label (points 5
* and 6 which come after NULL) will get the default value. We also set a
* font for the custom items as an extra example.
*/
lxw_chart_data_label data_label7_1 = {.value = "=Sheet1!$C$2", .font = &font2};
lxw_chart_data_label data_label7_2 = {0};
lxw_chart_data_label data_label7_3 = {.value = "=Sheet1!$C$4", .font = &font2};
lxw_chart_data_label data_label7_4 = {.value = "=Sheet1!$C$5", .font = &font2};
/* Create an array of label pointers. NULL indicates the end of the array. */
lxw_chart_data_label *data_labels7[] = {
&data_label7_1,
&data_label7_2,
&data_label7_3,
&data_label7_4,
NULL
};
/* Set the custom labels. */
chart_series_set_labels_custom(series, data_labels7);
/* Turn off the legend. */
/* Insert the chart into the worksheet. */
worksheet_insert_chart_opt(worksheet, CELL("D98"), chart, &options);
/*
* Chart 8. Example with deleted/hidden custom data labels.
*/
/* Add a chart title. */
chart_title_set_name(chart, "Chart with deleted data labels");
/* Add a data series to the chart. */
series = chart_add_series(chart, "=Sheet1!$A$2:$A$7",
"=Sheet1!$B$2:$B$7");
/* Add the series data labels. */
/* Create some custom labels. */
/* An initialized struct like this would also work: */
/* lxw_chart_data_label keep = {0}; */
/* Create an array of label pointers. NULL indicates the end of the array. */
lxw_chart_data_label *data_labels8[] = {
&hide,
&keep,
&hide,
&hide,
&keep,
&hide,
NULL
};
/* Set the custom labels. */
chart_series_set_labels_custom(series, data_labels8);
/* Turn off the legend. */
/* Insert the chart into the worksheet. */
worksheet_insert_chart_opt(worksheet, CELL("D114"), chart, &options);
/*
* Chart 9.Example with custom string data labels and formatting.
*/
/* Add a chart title. */
chart_title_set_name(chart, "Chart with custom labels and formatting");
/* Add a data series to the chart. */
series = chart_add_series(chart, "=Sheet1!$A$2:$A$7",
"=Sheet1!$B$2:$B$7");
/* Add the series data labels. */
/* Set the border/line and fill for the data labels. */
/* Create some custom labels. */
lxw_chart_data_label data_label9_1 = {.value = "Amy", .line = &line3};
lxw_chart_data_label data_label9_2 = {.value = "Bea"};
lxw_chart_data_label data_label9_3 = {.value = "Eva"};
lxw_chart_data_label data_label9_4 = {.value = "Fay"};
lxw_chart_data_label data_label9_5 = {.value = "Liv"};
lxw_chart_data_label data_label9_6 = {.value = "Una", .fill = &fill3};
/* Set the default formatting for the data labels in the series. */
/* Create an array of label pointers. NULL indicates the end of the array. */
lxw_chart_data_label *data_labels9[] = {
&data_label9_1,
&data_label9_2,
&data_label9_3,
&data_label9_4,
&data_label9_5,
&data_label9_6,
NULL
};
/* Set the custom labels. */
chart_series_set_labels_custom(series, data_labels9);
/* Turn off the legend. */
/* Insert the chart into the worksheet. */
worksheet_insert_chart_opt(worksheet, CELL("D130"), chart, &options);
return workbook_close(workbook);
}
workbook_close
lxw_error workbook_close(lxw_workbook *workbook)
Close the Workbook object and write the XLSX file.
chart_series_set_labels_custom
lxw_error chart_series_set_labels_custom(lxw_chart_series *series, lxw_chart_data_label *data_labels[])
Set the properties for data labels in a series.
lxw_chart_options
Options for inserted charts.
Definition: worksheet.h:1746
chart_series_set_labels_font
void chart_series_set_labels_font(lxw_chart_series *series, lxw_chart_font *font)
Set the font properties for chart data labels in a series.
LXW_FALSE
@ LXW_FALSE
Definition: common.h:51
lxw_chart_data_label::value
char * value
Definition: chart.h:803
chart_add_series
lxw_chart_series * chart_add_series(lxw_chart *chart, const char *categories, const char *values)
Add a data series to a chart.
lxw_chart_options::x_offset
int32_t x_offset
Definition: worksheet.h:1749
workbook_new
lxw_workbook * workbook_new(const char *filename)
Create a new workbook object.
lxw_chart_font::color
lxw_color_t color
Definition: chart.h:726
format_set_bold
void format_set_bold(lxw_format *format)
Turn on bold for the format font.
lxw_chart_line
Struct to represent a chart line.
Definition: chart.h:639
chart_series_set_labels_line
void chart_series_set_labels_line(lxw_chart_series *series, lxw_chart_line *line)
Set the line properties for the data labels in a chart series.
LXW_COLOR_YELLOW
@ LXW_COLOR_YELLOW
Definition: format.h:226
lxw_chart_font
Struct to represent a chart font.
Definition: chart.h:699
lxw_worksheet
Struct to represent an Excel worksheet.
Definition: worksheet.h:2107
lxw_chart_data_label
Struct to represent an Excel chart data label.
Definition: chart.h:799
lxw_format
Struct to represent the formatting properties of an Excel format.
Definition: format.h:358
LXW_TRUE
@ LXW_TRUE
Definition: common.h:53
lxw_chart
Struct to represent an Excel chart.
Definition: chart.h:1090
lxw_chart_series
Struct to represent an Excel chart data series.
Definition: chart.h:960
lxw_chart_fill::color
lxw_color_t color
Definition: chart.h:666
LXW_COLOR_GREEN
@ LXW_COLOR_GREEN
Definition: format.h:196
chart_series_set_labels
void chart_series_set_labels(lxw_chart_series *series)
Add data labels to a chart series.
lxw_chart_fill
Struct to represent a chart fill.
Definition: chart.h:663
lxw_chart_line::color
lxw_color_t color
Definition: chart.h:642
lxw_workbook
Struct to represent an Excel workbook.
Definition: workbook.h:292
worksheet_insert_chart_opt
lxw_error worksheet_insert_chart_opt(lxw_worksheet *worksheet, lxw_row_t row, lxw_col_t col, lxw_chart *chart, lxw_chart_options *user_options)
Insert a chart object into a worksheet, with options.
chart_legend_set_position
void chart_legend_set_position(lxw_chart *chart, uint8_t position)
Set the position of the chart legend.
chart_series_set_labels_options
void chart_series_set_labels_options(lxw_chart_series *series, uint8_t show_name, uint8_t show_category, uint8_t show_value)
Set the display options for the labels of a data series.
chart_title_set_name
void chart_title_set_name(lxw_chart *chart, const char *name)
Set the title of the chart.
LXW_COLOR_BLUE
@ LXW_COLOR_BLUE
Definition: format.h:184
lxw_chart_font::bold
uint8_t bold
Definition: chart.h:708
worksheet_write_string
lxw_error worksheet_write_string(lxw_worksheet *worksheet, lxw_row_t row, lxw_col_t col, const char *string, lxw_format *format)
Write a string to a worksheet cell.
LXW_COLOR_RED
@ LXW_COLOR_RED
Definition: format.h:217
worksheet_write_number
lxw_error worksheet_write_number(lxw_worksheet *worksheet, lxw_row_t row, lxw_col_t col, double number, lxw_format *format)
Write a number to a worksheet cell.
lxw_chart_data_label::hide
uint8_t hide
Definition: chart.h:807
CELL
#define CELL(cell)
Convert an Excel A1 cell string into a (row, col) pair.
Definition: utility.h:45
workbook_add_worksheet
lxw_worksheet * workbook_add_worksheet(lxw_workbook *workbook, const char *sheetname)
Add a new worksheet to a workbook.
workbook_add_chart
lxw_chart * workbook_add_chart(lxw_workbook *workbook, uint8_t chart_type)
Create a new chart to be added to a worksheet:
LXW_CHART_LEGEND_NONE
@ LXW_CHART_LEGEND_NONE
Definition: chart.h:167
workbook_add_format
lxw_format * workbook_add_format(lxw_workbook *workbook)
Create a new Format object to formats cells in worksheets.
chart_series_set_labels_fill
void chart_series_set_labels_fill(lxw_chart_series *series, lxw_chart_fill *fill)
Set the fill properties for the data labels in a chart series.
LXW_CHART_COLUMN
@ LXW_CHART_COLUMN
Definition: chart.h:113