| << chart_radar.c | chart_doughnut.c >> |
Examples of creating an Excel Pie chart.
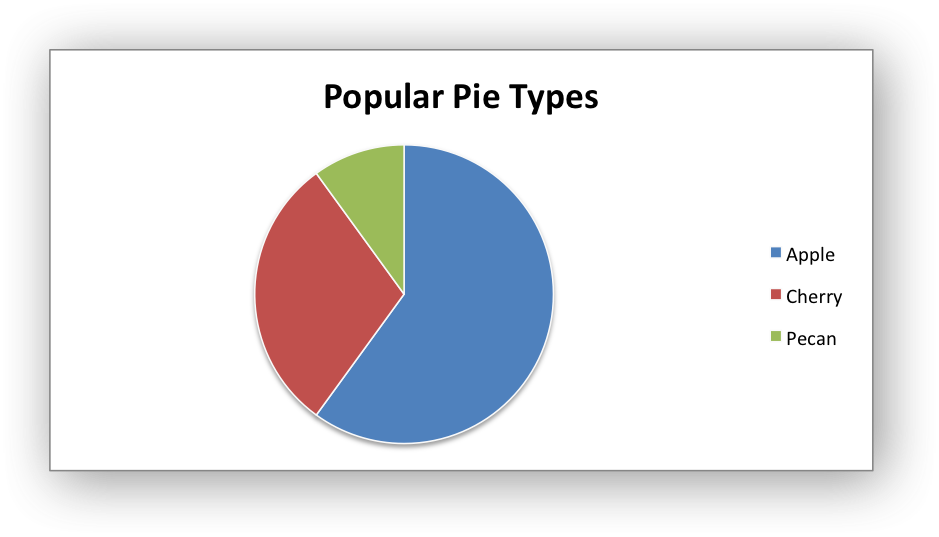
The default pie chart:
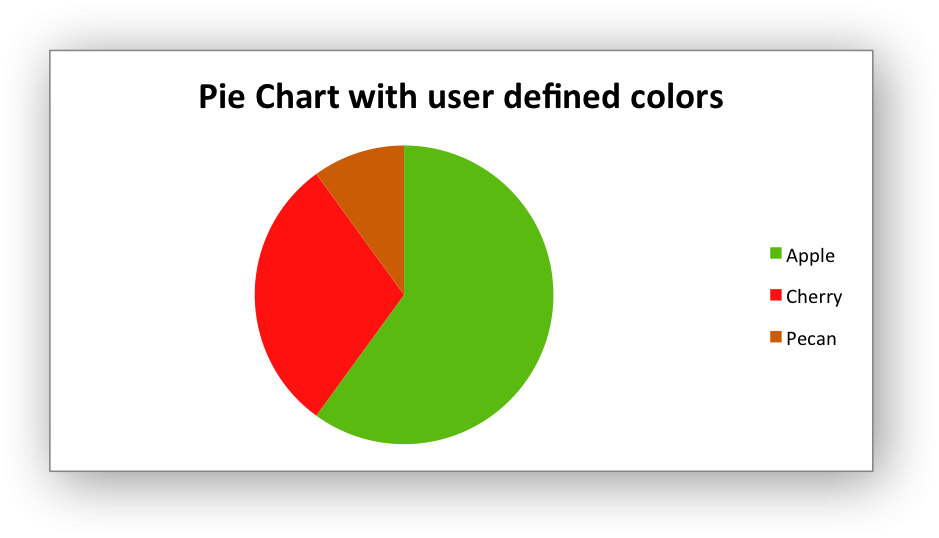
A pie chart with user defined colors:
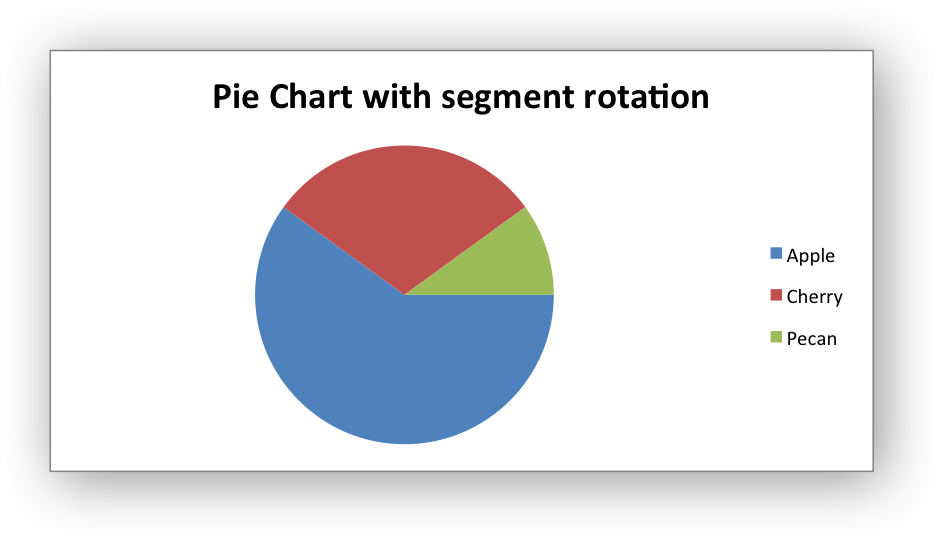
A pie chart with rotated segments:
/*
* An example of creating an Excel pie chart using the libxlsxwriter library.
*
* The demo also shows how to set segment colors. It is possible to define
* chart colors for most types of libxlsxwriter charts via the series
* formatting functions. However, Pie/Doughnut charts are a special case since
* each segment is represented as a point so it is necessary to assign
* formatting to each point in the series.
*
* Copyright 2014-2026, John McNamara, jmcnamara@cpan.org
*
*/
#include "xlsxwriter.h"
/*
* Write some data to the worksheet.
*/
}
/*
* Create a worksheet with examples charts.
*
*/
int main() {
lxw_chart *chart ;
lxw_chart_series *series;
/* Add a bold format to use to highlight the header cells. */
format_set_bold(bold);
/* Write some data for the chart. */
write_worksheet_data(worksheet, bold);
/*
* Chart 1: Create a simple pie chart.
*/
/* Add the first series to the chart. */
/* Set the name for the series instead of the default "Series 1". */
/* Add a chart title. */
/* Set an Excel chart style. */
chart_set_style(chart, 10);
/* Insert the chart into the worksheet. */
/*
* Chart 2: Create a pie chart with user defined segment colors.
*/
chart = workbook_add_chart(workbook, LXW_CHART_PIE);
/* Add the first series to the chart. */
/* Set the name for the series instead of the default "Series 1". */
chart_series_set_name(series, "Pie sales data");
/* Add a chart title. */
chart_title_set_name(chart, "Pie Chart with user defined colors");
/* Add for fills for use in the chart. */
lxw_chart_fill fill2 = {.color = 0xFE110E};
lxw_chart_fill fill3 = {.color = 0xCA5C05};
/* Add some points with the above fills. */
lxw_chart_point point2 = {.fill = &fill2};
lxw_chart_point point3 = {.fill = &fill3};
/* Create an array of the point objects. */
lxw_chart_point *points[] = {&point1,
&point2,
&point3,
NULL};
/* Add/override the points/segments of the chart. */
chart_series_set_points(series, points);
/* Insert the chart into the worksheet. */
/*
* Chart 3: Create a pie chart with rotation of the segments.
*/
chart = workbook_add_chart(workbook, LXW_CHART_PIE);
/* Add the first series to the chart. */
/* Set the name for the series instead of the default "Series 1". */
chart_series_set_name(series, "Pie sales data");
/* Add a chart title. */
chart_title_set_name(chart, "Pie Chart with segment rotation");
/* Change the angle/rotation of the first segment. */
chart_set_rotation(chart, 90);
/* Insert the chart into the worksheet. */
}
lxw_error chart_series_set_points(lxw_chart_series *series, lxw_chart_point *points[])
Set the formatting for points in the series.
void chart_series_set_name(lxw_chart_series *series, const char *name)
Set the name of a chart series range.
lxw_chart_series * chart_add_series(lxw_chart *chart, const char *categories, const char *values)
Add a data series to a chart.
void chart_title_set_name(lxw_chart *chart, const char *name)
Set the title of the chart.
void chart_set_rotation(lxw_chart *chart, uint16_t rotation)
Set the Pie/Doughnut chart rotation.
#define CELL(cell)
Convert an Excel A1 cell string into a (row, col) pair.
Definition: utility.h:46
lxw_chart * workbook_add_chart(lxw_workbook *workbook, uint8_t chart_type)
Create a new chart to be added to a worksheet:
lxw_format * workbook_add_format(lxw_workbook *workbook)
Create a new Format object to formats cells in worksheets.
lxw_error workbook_close(lxw_workbook *workbook)
Close the Workbook object and write the XLSX file.
lxw_worksheet * workbook_add_worksheet(lxw_workbook *workbook, const char *sheetname)
Add a new worksheet to a workbook.
lxw_error worksheet_insert_chart(lxw_worksheet *worksheet, lxw_row_t row, lxw_col_t col, lxw_chart *chart)
Insert a chart object into a worksheet.
lxw_error worksheet_write_string(lxw_worksheet *worksheet, lxw_row_t row, lxw_col_t col, const char *string, lxw_format *format)
Write a string to a worksheet cell.
lxw_error worksheet_write_number(lxw_worksheet *worksheet, lxw_row_t row, lxw_col_t col, double number, lxw_format *format)
Write a number to a worksheet cell.