| << chart_fonts.c | chart_styles.c >> |
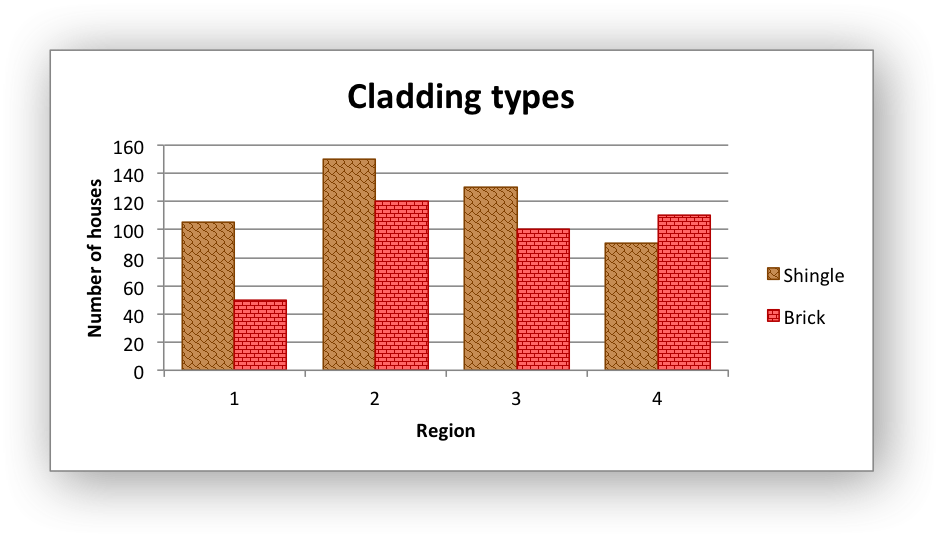
An example of creating a simple chart with different patterns.
/*
* An example of a simple Excel chart with patterns using the libxlsxwriter
* library.
*
* Copyright 2014-2026, John McNamara, jmcnamara@cpan.org
*
*/
#include "xlsxwriter.h"
/* Create a worksheet with a chart. */
int main() {
lxw_chart *chart;
/* Add a bold format to use to highlight the header cells. */
format_set_bold(bold);
/* Write some data for the chart. */
worksheet_write_number(worksheet, 1, 0, 105, NULL);
worksheet_write_number(worksheet, 2, 0, 150, NULL);
worksheet_write_number(worksheet, 3, 0, 130, NULL);
worksheet_write_number(worksheet, 4, 0, 90, NULL);
worksheet_write_string(worksheet, 0, 1, "Brick", bold);
worksheet_write_number(worksheet, 1, 1, 50, NULL);
worksheet_write_number(worksheet, 2, 1, 120, NULL);
worksheet_write_number(worksheet, 3, 1, 100, NULL);
worksheet_write_number(worksheet, 4, 1, 110, NULL);
/* Create a chart object. */
/* Configure the chart. */
chart_series_set_name(series2, "=Sheet1!$B$1");
/* Configure an add the chart series patterns. */
.fg_color = 0x804000,
.bg_color = 0XC68C53};
.fg_color = 0XB30000,
.bg_color = 0XFF6666};
chart_series_set_pattern(series1, &pattern1);
chart_series_set_pattern(series2, &pattern2);
/* Configure and set the chart series borders. */
lxw_chart_line line2 = {.color = 0xb30000};
chart_series_set_line(series1, &line1);
chart_series_set_line(series2, &line2);
/* Widen the gap between the series/categories. */
chart_set_series_gap(chart, 70);
/* Insert the chart into the worksheet. */
}
void chart_series_set_pattern(lxw_chart_series *series, lxw_chart_pattern *pattern)
Set the pattern properties for a chart series.
void chart_series_set_name(lxw_chart_series *series, const char *name)
Set the name of a chart series range.
void chart_set_series_gap(lxw_chart *chart, uint16_t gap)
Set the gap between series in a Bar/Column chart.
void chart_series_set_line(lxw_chart_series *series, lxw_chart_line *line)
Set the line properties for a chart series.
void chart_axis_set_name(lxw_chart_axis *axis, const char *name)
Set the name caption of the an axis.
lxw_chart_series * chart_add_series(lxw_chart *chart, const char *categories, const char *values)
Add a data series to a chart.
void chart_title_set_name(lxw_chart *chart, const char *name)
Set the title of the chart.
#define CELL(cell)
Convert an Excel A1 cell string into a (row, col) pair.
Definition: utility.h:46
lxw_chart * workbook_add_chart(lxw_workbook *workbook, uint8_t chart_type)
Create a new chart to be added to a worksheet:
lxw_format * workbook_add_format(lxw_workbook *workbook)
Create a new Format object to formats cells in worksheets.
lxw_error workbook_close(lxw_workbook *workbook)
Close the Workbook object and write the XLSX file.
lxw_worksheet * workbook_add_worksheet(lxw_workbook *workbook, const char *sheetname)
Add a new worksheet to a workbook.
lxw_error worksheet_insert_chart(lxw_worksheet *worksheet, lxw_row_t row, lxw_col_t col, lxw_chart *chart)
Insert a chart object into a worksheet.
lxw_error worksheet_write_string(lxw_worksheet *worksheet, lxw_row_t row, lxw_col_t col, const char *string, lxw_format *format)
Write a string to a worksheet cell.
lxw_error worksheet_write_number(lxw_worksheet *worksheet, lxw_row_t row, lxw_col_t col, double number, lxw_format *format)
Write a number to a worksheet cell.