| << chart_clustered.c | chart_data_tools.c >> |
Example of creating charts with data tables.
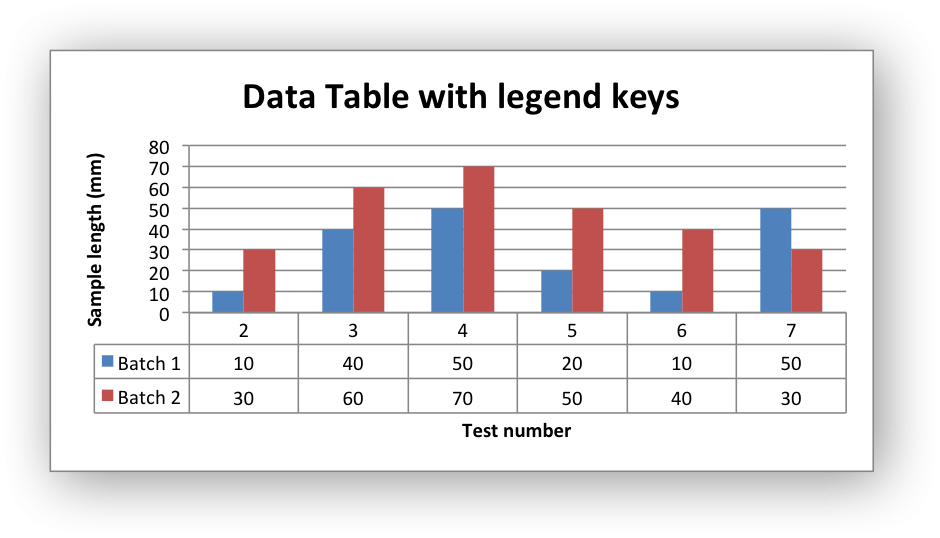
Chart 1 in the following example is a column chart with default data table:

Chart 2 is a column chart with default data table with legend keys:
/*
* An example of creating Excel column charts with data tables using the
* libxlsxwriter library.
*
* Copyright 2014-2026, John McNamara, jmcnamara@cpan.org
*
*/
#include "xlsxwriter.h"
/*
* Write some data to the worksheet.
*/
int row, col;
uint8_t data[6][3] = {
/* Three columns of data. */
{2, 10, 30},
{3, 40, 60},
{4, 50, 70},
{5, 20, 50},
{6, 10, 40},
{7, 50, 30}
};
for (row = 0; row < 6; row++)
for (col = 0; col < 3; col++)
worksheet_write_number(worksheet, row + 1, col, data[row][col] , NULL);
}
/*
* Create a worksheet with examples charts.
*/
int main() {
lxw_chart_series *series;
/* Add a bold format to use to highlight the header cells. */
format_set_bold(bold);
/* Write some data for the chart. */
write_worksheet_data(worksheet, bold);
/*
* Chart 1. Create a column chart with a data table.
*/
/* Add the first series to the chart. */
/* Set the name for the series instead of the default "Series 1". */
/* Add a second series but leave the categories and values undefined. They
* can be defined later using the alternative syntax shown below. */
series = chart_add_series(chart, NULL, NULL);
/* Configure the series using a syntax that is easier to define programmatically. */
/* Add a chart title and some axis labels. */
/* Set a default data table on the X-axis. */
chart_set_table(chart);
/* Insert the chart into the worksheet. */
/*
* Chart 2. Create a column chart with a data table and legend keys.
*/
chart = workbook_add_chart(workbook, LXW_CHART_COLUMN);
/* Add the first series to the chart. */
/* Set the name for the series instead of the default "Series 1". */
chart_series_set_name(series, "=Sheet1!$B$1");
/* Add the second series to the chart. */
/* Set the name for the series instead of the default "Series 2". */
chart_series_set_name(series, "=Sheet1!$C$1");
/* Add a chart title and some axis labels. */
chart_title_set_name(chart, "Data Table with legend keys");
/* Set a data table on the X-axis with the legend keys shown. */
chart_set_table(chart);
/* Turn off the legend. */
/* Insert the chart into the worksheet. */
}
void chart_set_table(lxw_chart *chart)
Turn on a data table below the horizontal axis.
void chart_series_set_name(lxw_chart_series *series, const char *name)
Set the name of a chart series range.
void chart_axis_set_name(lxw_chart_axis *axis, const char *name)
Set the name caption of the an axis.
lxw_chart_series * chart_add_series(lxw_chart *chart, const char *categories, const char *values)
Add a data series to a chart.
void chart_set_table_grid(lxw_chart *chart, uint8_t horizontal, uint8_t vertical, uint8_t outline, uint8_t legend_keys)
Turn on/off grid options for a chart data table.
void chart_title_set_name(lxw_chart *chart, const char *name)
Set the title of the chart.
void chart_series_set_categories(lxw_chart_series *series, const char *sheetname, lxw_row_t first_row, lxw_col_t first_col, lxw_row_t last_row, lxw_col_t last_col)
Set a series "categories" range using row and column values.
void chart_series_set_values(lxw_chart_series *series, const char *sheetname, lxw_row_t first_row, lxw_col_t first_col, lxw_row_t last_row, lxw_col_t last_col)
Set a series "values" range using row and column values.
void chart_legend_set_position(lxw_chart *chart, uint8_t position)
Set the position of the chart legend.
void chart_series_set_name_range(lxw_chart_series *series, const char *sheetname, lxw_row_t row, lxw_col_t col)
Set a series name formula using row and column values.
#define CELL(cell)
Convert an Excel A1 cell string into a (row, col) pair.
Definition: utility.h:46
lxw_chart * workbook_add_chart(lxw_workbook *workbook, uint8_t chart_type)
Create a new chart to be added to a worksheet:
lxw_format * workbook_add_format(lxw_workbook *workbook)
Create a new Format object to formats cells in worksheets.
lxw_error workbook_close(lxw_workbook *workbook)
Close the Workbook object and write the XLSX file.
lxw_worksheet * workbook_add_worksheet(lxw_workbook *workbook, const char *sheetname)
Add a new worksheet to a workbook.
lxw_error worksheet_insert_chart(lxw_worksheet *worksheet, lxw_row_t row, lxw_col_t col, lxw_chart *chart)
Insert a chart object into a worksheet.
lxw_error worksheet_write_string(lxw_worksheet *worksheet, lxw_row_t row, lxw_col_t col, const char *string, lxw_format *format)
Write a string to a worksheet cell.
lxw_error worksheet_write_number(lxw_worksheet *worksheet, lxw_row_t row, lxw_col_t col, double number, lxw_format *format)
Write a number to a worksheet cell.