Struct to represent Excel chart element layout dimensions. More...
Detailed Description
Excel supports manual positioning of elements such as the chart axis labels, the chart legend, the chart plot area and the chart title. The lxw_chart_layout struct represents the layout dimension for these elements.
The layout units used by Excel are relative units expressed as a percentage of the chart dimensions and are double values in the range 0.0 < x <= 1.0. Excel calculates these dimensions as shown below:
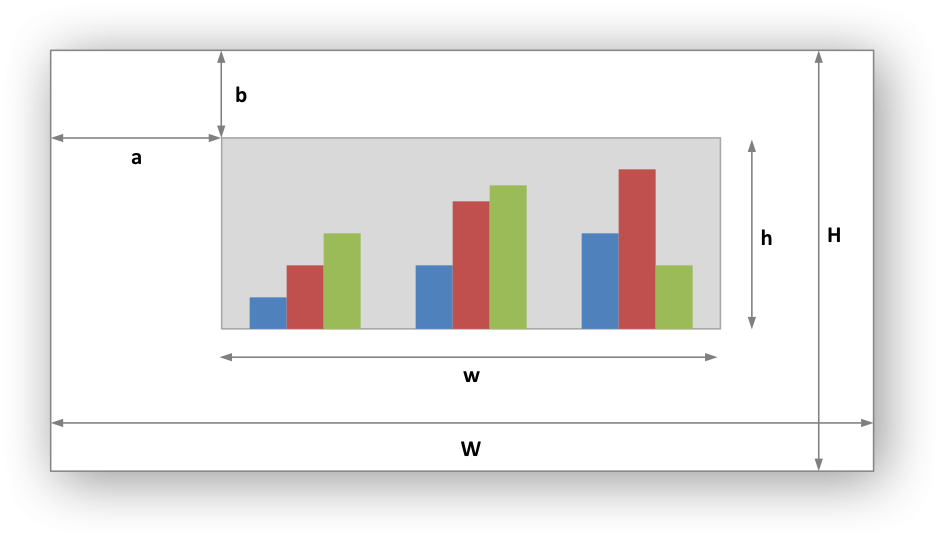
With reference to the above figure the layout units are calculated as follows:
These units are cumbersome and can vary depending on other elements in the chart such as text lengths. However, these are the units that are required by Excel to allow relative positioning. Some trial and error is generally required.
For the chart chart_plotarea_set_layout() and chart_legend_set_layout() functions you can also set the width and height based on the following calculation:
For other text based objects the width and height are changed by the font dimensions.
The chart functions that support lxw_chart_layout are:
Data Fields | |
| double | x |
| double | y |
| double | width |
| double | height |
Field Documentation
◆ x
| double lxw_chart_layout::x |
The x offset in the range 0.0 < x <= 1.0
◆ y
| double lxw_chart_layout::y |
The y offset in the range 0.0 < y <= 1.0
◆ width
| double lxw_chart_layout::width |
The width of the plotarea or legend in the range 0.0 < x <= 1.0
◆ height
| double lxw_chart_layout::height |
The height of the plotarea or legend in the range 0.0 < x <= 1.0